
Error Logs
TelemetryTV appears to offer a comprehensive logging system that provides users with various ways to access and analyze logs:
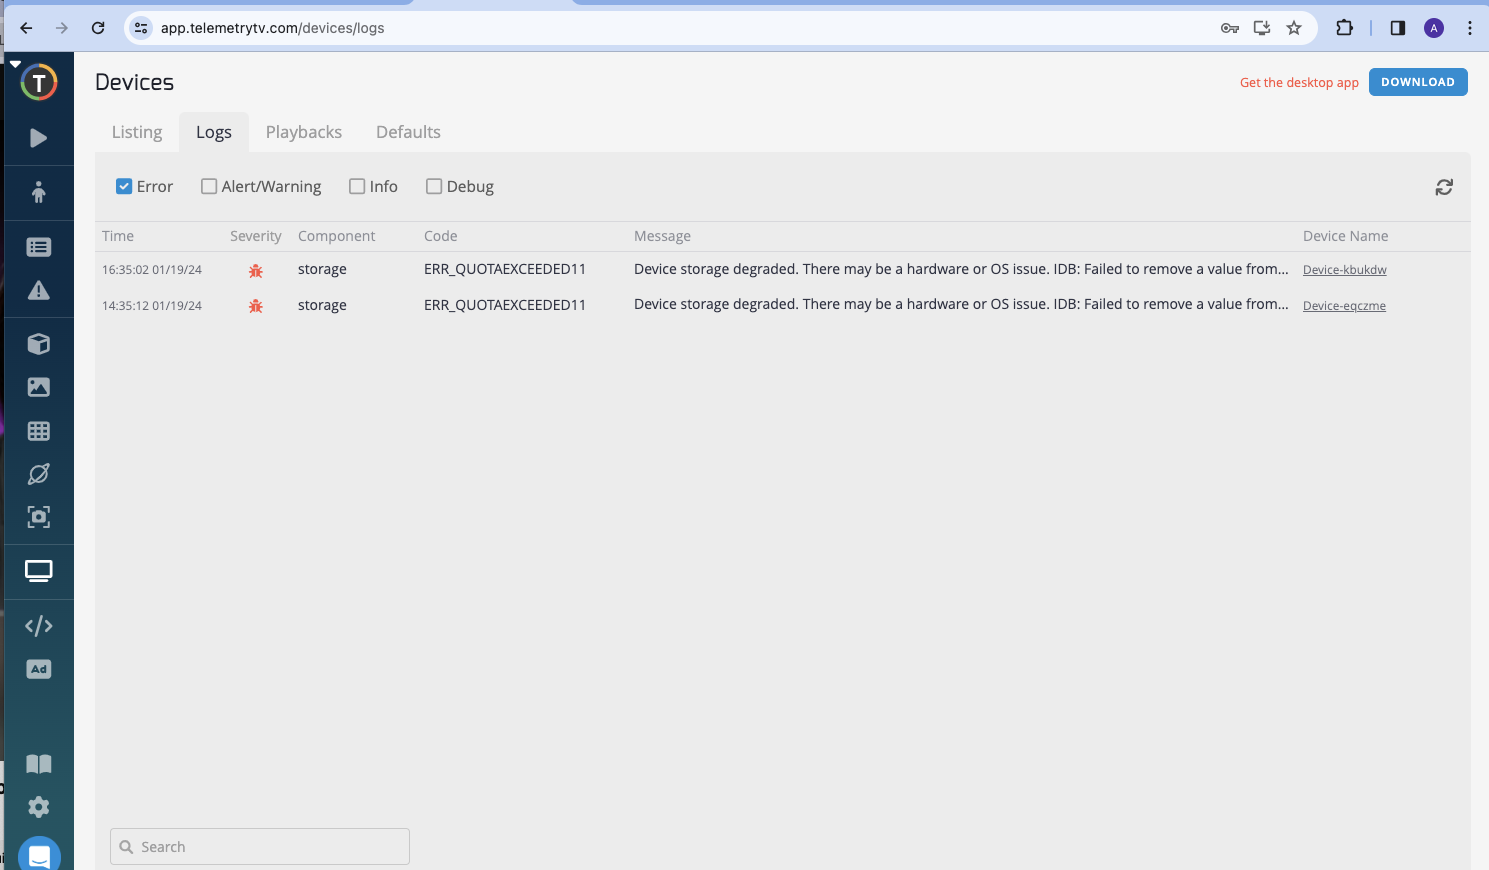
TelemetryTV Interface - Logs Tab (Aggregated View):
- This tab serves as a centralized log aggregation point where you can view logs from all devices connected to the TelemetryTV networkg
- It's useful for getting an overview of the system's health and for spotting widespread issues that might be affecting multiple devices.
- You can typically filter these logs by severity, search by device, time, and possibly other criteria to quickly find the information you need.
Click here for more information on reporting an issue.
Detailed View
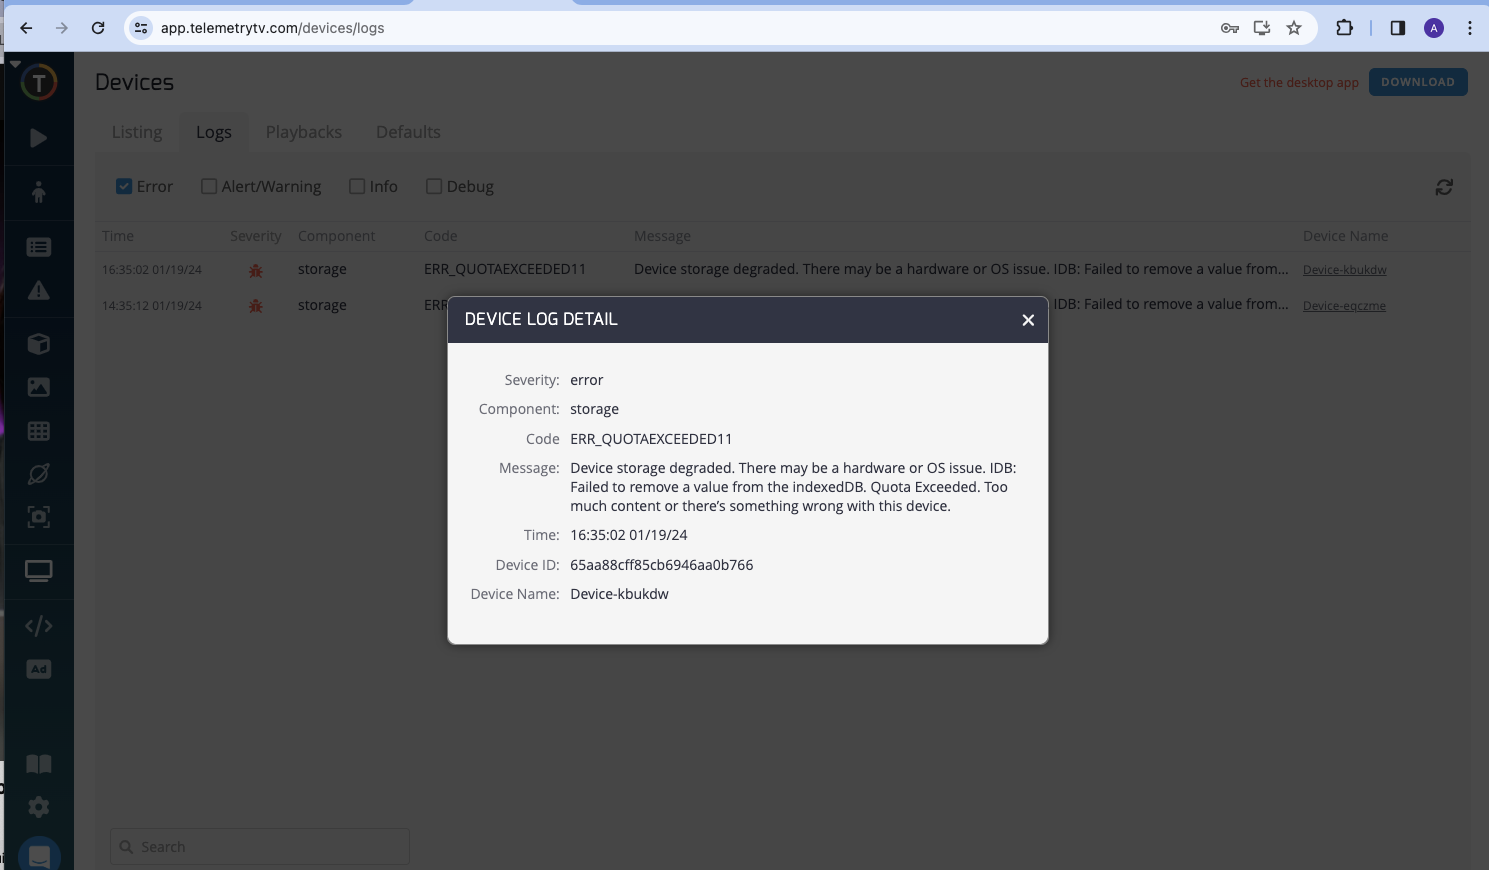
Logs from a device Logs
Device Debug Console Debug Console
Initial Steps:
Check the Logs Immediately:
As soon as an unexpected behavior is noticed, the first step should always be to check the logs. This is because logs can provide real-time insights into what the application is doing behind the scenes.
Identify Log Severity:
Logs come with different severity lebug, Info, Warning, Error, and Critical. Pay special attention to Error and Critical logs, as these are most likely pertain to unexpected behaviors.
Look for Exception Messages:
Exception messages in logs are deliberately placed by developers to highlight where an issue has occurred. These exceptions often include a stack trace or error message that can pinpoint the exact location in the code where the behavior deviated from the expected path.
Unhandled Errors:
Unhandled errors are those that were not explicitly caught by the application's error handling routines. These are critical because they can indicate edge cases or unforeseen scenarios that were not accounted for during development.
Analyzing Logs:
Filter and Search:
Use the filtering and search functionalities within the TelemetryTV interface to isolate logs from around the time the issue was first observed.
Correlate Events:
Try to correlate the unexpected behavior with specific log entries. Look for patterns or repeated errors that coincide with the issues you're observing.
Note Timestamps:
Document the timestamps of relevant logs. This information will be crucial when you need to communicate the details to the support team.
Gather Context:
If possible, gather context around the error, such as what the application was doing at the time, any user interactions that occurred, and the state of the system.
Updated about 1 month ago